

What is lifecycle cost for paving surfaces?
Lifecycle cost for a paving surface is the total discounted cost of owning that pavement from initial construction through its final service year, including every maintenance treatment, rehabilitation, user impact, and remaining salvage value along the way. The FHWA defines LCCA as "a process for evaluating the total economic worth of a usable project segment by analyzing initial costs and discounted future costs, such as maintenance, user, reconstruction, rehabilitation, restoring, and resurfacing costs, over the life of the project segment."
Lifecycle cost analysis (LCCA) is the structured methodology that produces that number. Its purpose is comparison, not budgeting. You use it to identify which pavement design delivers the lowest long-term cost while meeting performance objectives, not to forecast a total project spend.
The primary cost categories in any LCCA are:
- Agency costs: Initial construction, future overlays, rehabilitation, and routine maintenance paid by the owning agency
- User costs: Delay, vehicle operating costs, and crash costs incurred by travelers during work zones
- Salvage value: The remaining economic value of pavement life at the end of the analysis period, entered as a negative cost to avoid penalizing longer-lasting designs
How to calculate lifecycle cost for a pavement project
The two accepted calculation methods are Net Present Value (NPV) and Equivalent Uniform Annual Cost (EUAC). NPV converts all future expenditures to a single present-day figure. EUAC spreads that present value into a uniform annual amount, which is useful when comparing alternatives with different service lives.
The INDOT Chapter 606 guidance recommends an analysis period of a sufficiently long period for new pavement comparisons, long enough to capture at least one full rehabilitation cycle for every alternative under review.
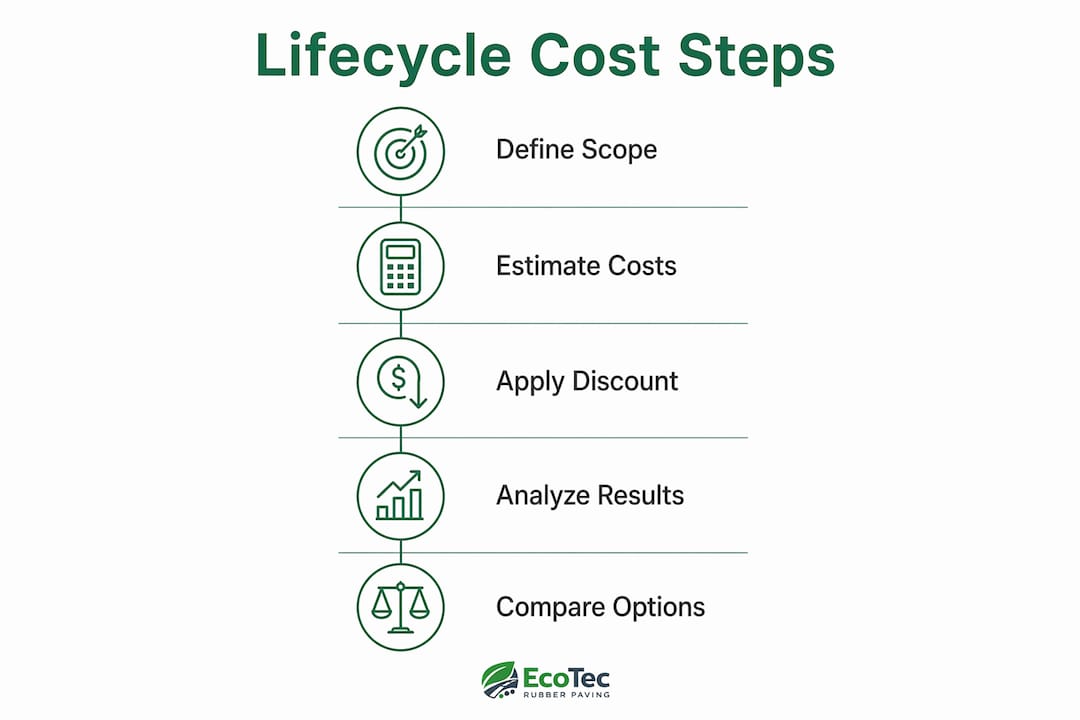
A standard LCCA calculation follows these steps:
- Define the analysis period and identify all competing design alternatives
- Estimate initial construction costs for each alternative
- Schedule future maintenance and rehabilitation activities with cost estimates
- Estimate user costs for each work zone activity
- Calculate salvage value for remaining pavement life at period end
- Apply a discount rate, typically between 3% and 7%, to bring all future costs to present value
- Sum discounted costs and subtract salvage value to get NPV for each alternative
- Run sensitivity analysis to test how results shift under different assumptions
Pro Tip: Never treat LCCA output as a budget figure. The analysis is a relative ranking tool. A design with a higher NPV than a competitor is the finding that matters, not the absolute dollar amount itself.
Discount rates reflect the opportunity cost of capital. A rate toward the lower end of the typical 3% to 7% range favors long-term investments because future costs shrink less aggressively, making durable pavements look more attractive relative to cheaper, shorter-lived options.
Comparing lifecycle costs across pavement types
Pavement type drives lifecycle cost more than almost any other single variable. The paving surface cost breakdown looks very different for asphalt, concrete, composite, and permeable designs once you extend the horizon past the first decade.
- Asphalt: Lower initial cost, but rehabilitation cycles come more frequently, and each work zone event generates measurable user delay costs
- Portland cement concrete (PCC): Higher upfront investment, but longer intervals between major rehabilitation and lower cumulative maintenance spending over a multi-decade horizon
- Composite (asphalt over concrete): Combines the ride quality of asphalt with the structural longevity of concrete; rehabilitation typically involves milling and overlaying rather than full reconstruction
- Permeable pavements: Reduce stormwater management costs and can lower long-term drainage infrastructure expenses, though they require specialized maintenance to prevent clogging
Case studies confirm that higher upfront cost pavements, including composites and concrete, often produce lower total lifecycle costs over a 35-50 year horizon compared to traditional asphalt. The reason is straightforward: fewer rehabilitation events mean fewer work zones, and fewer work zones mean lower user costs.
"Initial lower cost pavements may have higher total lifecycle costs due to frequent rehabilitation and higher user delay costs impacting total value." — FHWA Life-Cycle Cost Analysis in Pavement Design
One practical illustration: an asphalt design that requires periodic milling and overlay every several years will accumulate three or four work zone events over a 50-year analysis period. Each event carries delay costs for every vehicle that passes through. A concrete alternative requiring one major rehabilitation at year 30 may generate a fraction of those user costs, even if its construction invoice was significantly higher at the start.
How maintenance, performance data, and user costs shape LCCA outcomes

The quality of your input data determines whether your LCCA is a reliable decision tool or an expensive guess. INDOT's guidance is direct on this point: pavement functional lives used in cost comparisons should be based on Mechanistic-Empirical Pavement Design Guide (MEPDG) results and observed regional performance, not national averages.
Key data quality practices for valid LCCA:
- Use locally calibrated MEPDG models rather than default national parameters
- Source rehabilitation cost estimates from recent regional bid data
- Apply traffic volume and growth rates specific to the corridor, not statewide averages
- Conduct sensitivity analysis on every major assumption, especially rehabilitation timing and discount rate
User costs deserve particular attention. The FHWA technical bulletin notes that user delay and vehicle operating costs during maintenance can exceed agency construction and maintenance costs on high-volume corridors. That finding flips the conventional assumption that agency costs dominate the analysis.
Numbered priority order for cost inputs:
- User delay costs on high-volume roads (often the largest single cost driver)
- Rehabilitation frequency and timing (most sensitive assumption in the model)
- Initial construction cost (important but fixed; less variable than rehab timing)
- Salvage value (significant when alternatives have meaningfully different remaining lives at period end)
- Routine maintenance costs (real but typically small relative to rehab and user costs)
Sensitivity analysis is not optional. LCCA inputs carry genuine uncertainty, and a result that holds up across a range of discount rates and rehabilitation schedules is far more defensible than one that depends on a single optimistic assumption.
What recent research and sustainable paving tell us about lifecycle cost
Recent LCCA research reinforces one consistent finding: the analysis works best as a relative comparison tool, not an absolute cost predictor. Inputs like future fuel prices, traffic growth, and material costs all carry uncertainty that compounds over a 50-year horizon. The goal is to identify which alternative is more cost-effective, not to predict the exact dollar figure 40 years from now.
Sustainability factors are entering LCCA frameworks with increasing frequency. Environmental costs, including carbon emissions from production and rehabilitation, stormwater management savings, and heat island reduction, are now part of how forward-looking agencies evaluate long-term paving expenses. These factors do not replace NPV calculations; they supplement them.
Ecotecrubber's Rubberway® system illustrates how material innovation can shift the lifecycle cost equation. By using recycled rubber in a permeable, crack-resistant surface, Rubberway® installations address two of the most common cost drivers in Florida's climate: heat-induced cracking and standing water damage. Fewer crack repairs and reduced drainage infrastructure needs translate directly into lower paving maintenance costs over the asset's life.
"Sustainable paving innovations such as EcoTec Rubber's Rubberway® systems improve drainage, crack resistance, and ADA compliance, potentially lowering lifecycle costs through reduced maintenance frequency." — Ecotecrubber
Key sustainability factors now entering lifecycle cost assessments:
- Embodied carbon from material production and transportation
- Stormwater runoff reduction and associated infrastructure savings
- Surface heat absorption and urban heat island contribution
- Recycled content percentage and end-of-life recyclability
- ADA compliance costs avoided through surface design
Pro Tip: When presenting an LCCA to stakeholders, lead with the sensitivity analysis results, not just the base-case NPV. Showing that your preferred alternative wins across multiple discount rate and rehabilitation timing scenarios builds far more confidence than a single number.
Key Takeaways
Lifecycle cost analysis gives infrastructure decision-makers a structured way to identify the pavement design that delivers the lowest total cost over its full service life, not just the lowest bid price.
| Point | Details |
|---|---|
| LCCA is a comparison tool | Use it to rank alternatives by total discounted cost, not as a project budget forecast. |
| Analysis period matters | INDOT recommends an analysis period long enough to capture at least one full rehabilitation cycle for every alternative under review. |
| User costs often dominate | On high-volume roads, delay and vehicle operating costs during work zones can exceed agency construction costs. |
| Data quality drives accuracy | MEPDG-calibrated, regionally sourced inputs produce far more reliable results than national default values. |
| Sustainable materials shift the equation | Products like Ecotecrubber's Rubberway® reduce rehabilitation frequency, directly lowering long-term paving expenses. |