
Measure community impact for a paving project with a focused mixed-methods evaluation that combines community-defined indicators, baseline technical KPIs, and a before–after or quasi-experimental design. That single sentence is the whole framework. Everything below is how you actually execute it.
Before you collect a single data point, lock in these five steps:
- Define scope and outcomes. Decide whether you are measuring a resurfacing, a new installation, or a neighborhood-wide upgrade, and name the outcomes you care about: safety, mobility, equity, environmental quality, or economic effects.
- Set a technical baseline. Pull Pavement Condition Index (PCI) scores from your state DOT dataset or the Federal Highway Administration's Highway Performance Monitoring System (HPMS), and collect crash counts, travel-time estimates, and accessibility data before construction starts.
- Run a short community survey. A 10-question resident survey administered before paving captures perceived safety, standing-water complaints, and accessibility concerns that no technical dataset will give you.
- Choose your evaluation design. A simple before–after comparison works for most projects. For higher-stakes decisions or equity-focused investments, a quasi-experimental design with matched comparison corridors is worth the extra effort.
- Plan data sources and a follow-up timeline. Budget for at least one post-construction data pull at 6 months and a second at 12–36 months. Short-term outputs (new pavement installed) and long-term outcomes (reduced crashes, property value changes) require different collection windows.
Two federal frameworks shape how you frame this work. The Bipartisan Infrastructure Law directs significant pavement funding toward underserved communities, and the Justice40 initiative requires that 40% of certain federal investment benefits flow to disadvantaged communities. Both create a policy mandate to measure equity outcomes, not just engineering outputs. The Highway Economic Requirements System (HERS) and HPMS provide the technical backbone for translating pavement improvements into user benefits. MoDOT's performance-based approach to pavement prioritization is one of the cleaner state-level examples of integrating community outcomes into project selection. Bridgespan's research confirms that a culture-of-learning approach, where measurement is co-created with communities rather than imposed on them, consistently produces better outcomes than a top-down audit mindset.
Table of Contents
- What a community impact assessment looks like for paving projects
- Which impact domains should you track for a paving project?
- Concrete indicators and the U.S. datasets that provide them
- Which evaluation design gives you credible results?
- A practical measurement plan your team can follow
- What the evidence actually shows about paving project outcomes
- Tools and templates planners can actually use
- Practical measurement tips from Ecotecrubber
- Key Takeaways
- Why the measurement conversation in paving is still missing the point
- Ecotecrubber supports measurement-aligned paving pilots for municipalities
- Useful sources for further reading
What a community impact assessment looks like for paving projects
A Community Impact Assessment (CIA) for a paving project is a structured process for identifying, predicting, and measuring the effects of a pavement intervention on the people who live, work, or travel through the affected area. It goes well beyond the engineering report. Where a pavement management report tells you the road went from a PCI of 38 to 72, a CIA tells you whether that change reduced pedestrian injuries, cut commute costs for low-income households, or improved access to a grocery store.
The distinction between outputs and outcomes is the most important concept to get right before you start. Outputs are what you install: lane-miles resurfaced, ADA ramps added, square footage of new surface. Outcomes are what changes in people's lives: fewer crashes at a school crossing, lower vehicle operating costs for residents who drive on the corridor daily, reduced standing water that was breeding mosquitoes near a playground. Funders and community members care about outcomes. Your measurement plan needs to track both, but outcomes are what justify the investment.
When to run a CIA depends on the project's scale and decision context. For any project that touches a federally funded corridor, a CIA is effectively required under NEPA and FHWA guidance. For state or locally funded resurfacing, a lightweight CIA is still worth running when the project is in a Justice40-designated community, when the corridor serves a school, transit stop, or medical facility, or when the project is being used to make a prioritization case to elected officials. The Bipartisan Infrastructure Law has raised the bar: planners who cannot show community benefit data are increasingly at a disadvantage in competitive grant rounds.
CIAs work best when communities help design them. Residents know which intersections are dangerous at school dismissal time, which blocks flood after rain, and which sidewalk gaps prevent elderly neighbors from reaching the bus stop. That knowledge does not appear in HPMS. Participatory Impact Assessment (PIA) tools from Tufts' Feinstein International Center offer practical methods for capturing community-defined indicators, especially where baseline data are thin.
Which impact domains should you track for a paving project?
Six domains cover the full range of effects a paving project can produce. Each maps to measurable indicators, which the next section details.
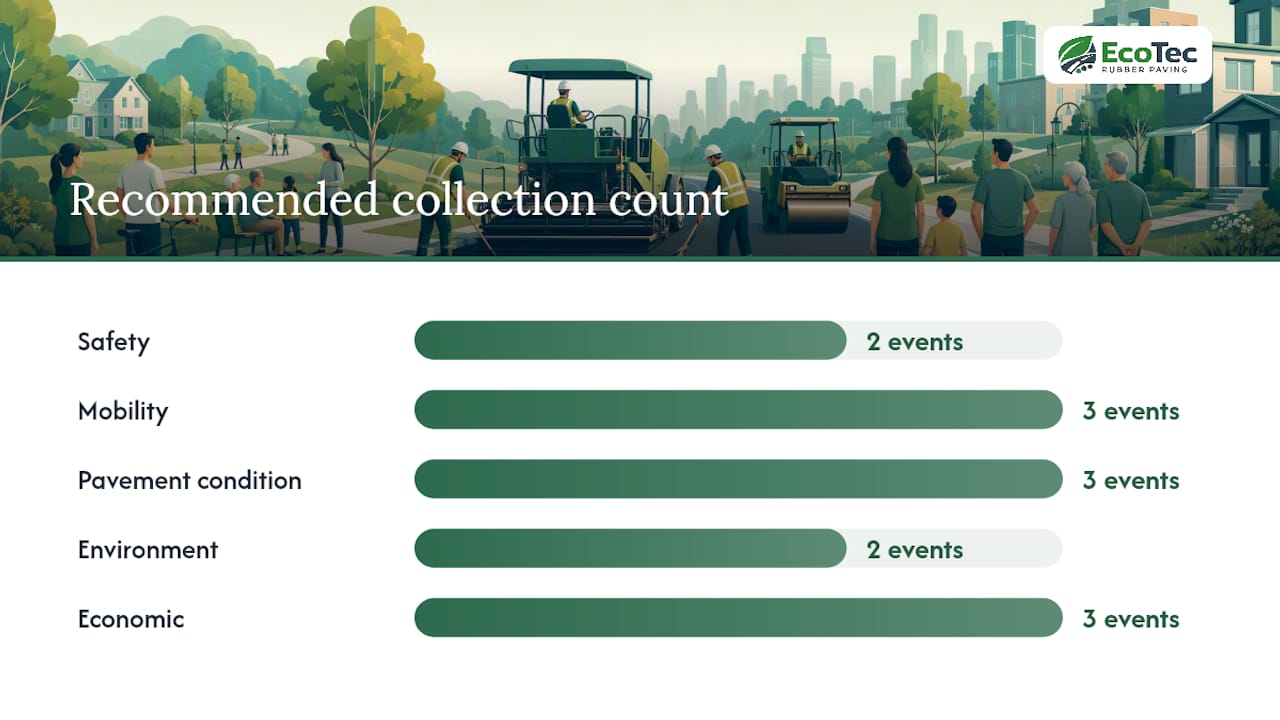
- Safety. Crash counts, crash severity (KSI: killed or seriously injured), and pedestrian/cyclist incident rates. Safety is usually the easiest domain to quantify because crash data exists in every state DOT database.
- Mobility and accessibility. Travel time, vehicle delay, pedestrian delay at crossings, and proximity to transit stops or essential services. Accessibility audits that document ADA compliance before and after installation belong here.
- Public health. Air quality proxies tied to vehicle idling and rough pavement, standing-water reduction (which affects vector-borne disease risk), and noise levels near residential areas.
- Environmental quality. Stormwater runoff volume, emissions proxies linked to vehicle operating conditions on rough pavement, and urban heat island effects. EPA transportation emissions data provides a standard baseline for estimating emissions co-benefits when pavement condition improves.
- Economic and property effects. Assessed property values along the corridor, business foot traffic, and vehicle operating costs (fuel, tire wear, maintenance). These are the indicators that translate most directly into benefit–cost analysis inputs.
- Equity and Environmental Justice. EJ overlay scores, proximity-to-services gaps for low-income or minority populations, and whether the project disproportionately benefits or burdens disadvantaged communities. Research published through the NSF PAR system found that EJ communities in Massachusetts were disproportionately located near poor-condition roads and faced higher excess fuel consumption relative to non-EJ areas, a finding that illustrates exactly why equity needs its own measurement lens rather than being folded into a general mobility metric.
The equity domain deserves special attention under Justice40. For example, a project that improves average travel time across a city may still widen the gap between well-served and underserved neighborhoods if the worst roads in EJ communities are not prioritized. Tracking equity separately forces that question into the open.
Concrete indicators and the U.S. datasets that provide them
The table below maps each domain to specific indicators, standard U.S. data sources, recommended collection frequency, and a note on data quality.
| Domain | Indicator | Primary U.S. Data Source | Collection Frequency | Data Quality Note |
|---|---|---|---|---|
| Safety | Crash rate, KSI count | State crash database, FARS | Baseline + annual | Underreporting of minor crashes is common; use 3-year rolling averages |
| Mobility | Travel time, vehicle delay | Traffic counts, HERE/Google Maps API, HPMS | Baseline + 6 mo + 2 yr | API data varies by coverage; supplement with manual counts on low-volume roads |
| Pavement condition | PCI score | State DOT PCI dataset, HPMS | Baseline + post-construction + biennial | Ensure same rating methodology pre/post for comparability |
| Environment | Emissions proxy, stormwater runoff | EPA emissions factors, local stormwater records | Baseline + post-construction | Emissions are estimated, not measured; flag as proxy |
| Economic | Assessed property value, business footfall | County assessor/parcel data, pedestrian counters | Baseline + 1 yr + 3 yr | Assessor data lags 12 months; plan accordingly |
| Equity | EJ overlay score, proximity to services | EPA EJScreen, FHWA EJ mapping tools, GIS | Baseline + post-construction | Combine with survey data; EJScreen is a screening tool, not a definitive score |
| Community perception | Resident satisfaction, perceived safety | Local household survey | Baseline + 6 mo + 2 yr | Response rates below 30% reduce reliability; use incentives |
HPMS is the federal backbone. It collects pavement condition, traffic volume, and road characteristics data from state DOTs and feeds directly into HERS modeling. If your project corridor is on the National Highway System, HPMS data is already being collected; your job is to extract the relevant segments and document pre-project values. For local roads not covered by HPMS, you will need to collect PCI scores directly, either through a contracted pavement inspection or a windshield survey using ASTM D6433 protocols.
For GIS-based EJ analysis, EPA's EJScreen tool lets you draw a buffer around a project corridor and pull demographic and environmental burden scores in minutes. Pair that with FHWA's mapping resources and you have a defensible equity baseline without custom data collection.
Pro Tip: When building your indicator set, use community input methods to validate your technical list. Residents often surface indicators, like safe routes to a school or reduced flooding near a bus stop, that no dataset captures automatically.
Which evaluation design gives you credible results?
Design choice comes down to one question: do you need to prove the project caused the change, or is it enough to show that change occurred? For most municipal reporting, contribution (showing change happened and the project plausibly drove it) is sufficient. Attribution (proving causation) requires more rigorous design.
Before–after comparison is the default for most paving projects. Collect baseline data, complete the project, collect the same data again at 6 months and 2 years. It is low cost and easy to communicate. The weakness is that other factors, economic shifts, seasonal variation, nearby development, can explain the change just as well as the paving.
Quasi-experimental designs with matched controls address that weakness. Select a comparable corridor that was not paved during the same period and track the same indicators on both. If the paved corridor improves while the comparison corridor stays flat, the case for project attribution strengthens considerably. The Urban Institute's literature review on community-level initiatives confirms that quasi-experimental and synthetic control methods produce the most credible causal claims for community-level interventions, while also flagging spillover effects as a real risk when treated and comparison areas are geographically close.
Synthetic control is useful when you have a single project site and enough historical data to construct a weighted comparison from multiple reference corridors. It is more technically demanding but increasingly accessible through tools like R's Synth package.
Social Life Cycle Assessment (S-LCA) and capability-based approaches are worth considering for larger projects where you need to document social sustainability across the full project lifecycle, from materials sourcing through end-of-life. S-LCA frameworks are less standardized than environmental LCA, but they can be adapted to quantify governance, worker welfare, and community well-being dimensions of a paving investment.
Mixed methods and Participatory Impact Assessment fill the gaps that statistical designs leave open. When baseline data are weak or community-defined indicators do not map to existing datasets, PIA tools like proportional piling and community scoring give residents a structured way to rank and weight outcomes. The result is qualitative evidence that can be triangulated with quantitative findings.
Pro Tip: Build a logic model before you collect any data. Map the causal path from pavement asset change (higher PCI) to intermediate outcomes (lower vehicle operating costs, fewer crashes) to long-term community outcomes (reduced household transportation burden, improved business access). A logic model lets you combine small-N quantitative tests with qualitative community evidence without overstating what either can prove.
A practical measurement plan your team can follow
This sequence works for a mid-size municipal paving project. Adjust scope and timeline for smaller resurfacing jobs or larger capital programs.
-
Scope the assessment (weeks 1–2). Define the project corridor, identify affected populations, and confirm which impact domains are in scope. Check Justice40 and EJ overlay status using EJScreen. Document the decision in a one-page assessment brief.
-
Engage stakeholders and co-create indicators (weeks 2–4). Hold at least one community meeting or online survey to surface resident priorities. Use PIA ranking tools if baseline data are thin. Cross-reference community priorities with your technical indicator list and finalize the indicator set. For procurement guidance on vendors who will support monitoring requirements, see how to evaluate eco-friendly paving vendor bids.
-
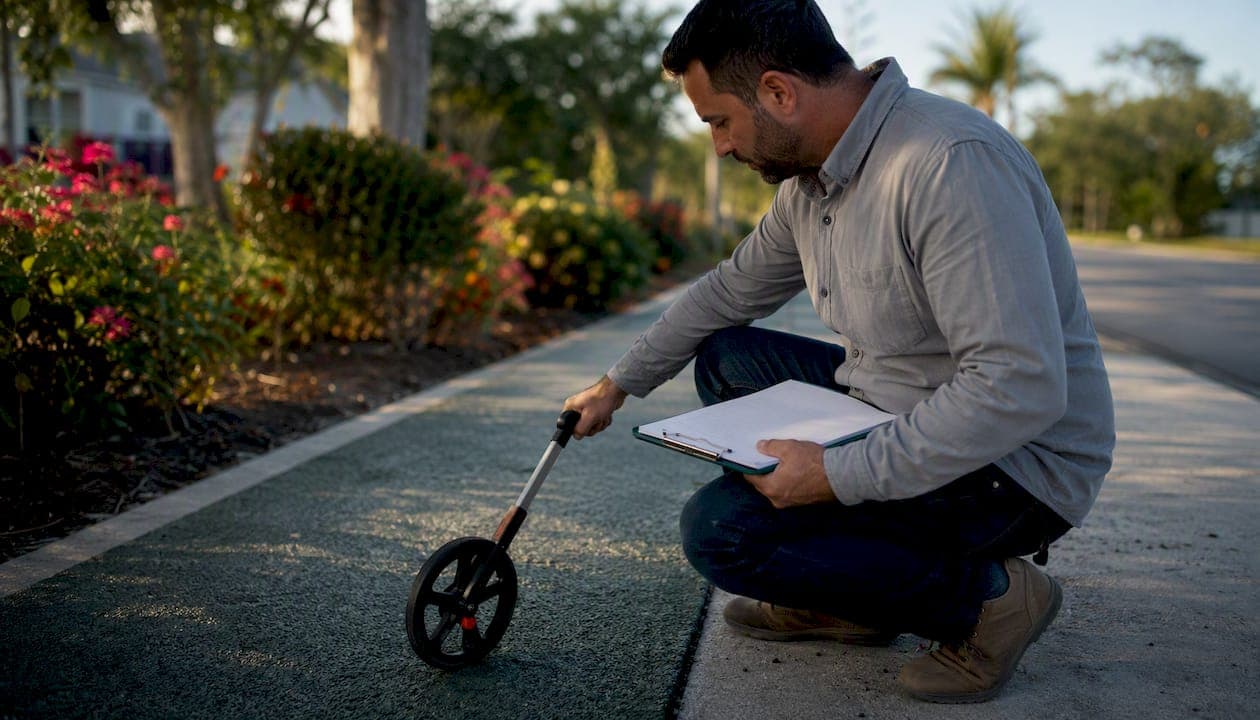
Collect baseline data (weeks 3–8). Pull PCI scores, crash data (3-year rolling), HPMS segment data, EJScreen scores, and county assessor values. Administer the resident survey. Photograph fixed reference points for visual before–after documentation. Budget roughly 40–80 staff hours for in-house data collection on a single corridor; more complex projects may warrant a contractor.
-
Select and document the evaluation design (week 6). Decide between before–after and quasi-experimental. If using matched controls, identify comparison corridors now and begin collecting baseline data on them simultaneously.
-
Implement and monitor during construction (project duration). Track construction-phase disruption indicators: detour delays, business access complaints, noise complaints. These are short-term negative impacts that belong in the full picture.
-
Post-construction data collection (6 months and 12–36 months post-completion). Repeat all baseline indicators. Re-administer the resident survey. Pull updated crash data (noting that crash trends take 2–3 years to stabilize). For a sustainable paving ROI business case, this is where you build the benefit–cost inputs.
-
Analyze and integrate findings (weeks 4–8 post-collection). Calculate change scores for each indicator. For economic indicators, translate vehicle operating cost savings and travel-time savings into dollar values using FHWA unit cost guidance. Feed these into HERS or a local LCCA model. HERS ranks pavement improvements by incremental benefit–cost ratio using HPMS inputs, so social-impact metrics that can be monetized (crash costs, vehicle operating costs, time savings) slot directly into that framework.
-
Report and communicate findings (weeks 8–12 post-analysis). Produce a plain-language summary for community audiences and a technical appendix for decision-makers. Map findings back to the original community-defined indicators so residents can see whether their priorities were addressed.
Data governance and ethics checklist: Obtain informed consent before collecting household survey data. Store personally identifiable information separately from indicator data. Anonymize responses before analysis. For projects in EJ communities, consider a community data-sharing agreement that gives residents access to findings before they are published. Check state privacy law requirements for any data collected through digital platforms.
For budget allocation guidance that pairs with this timeline, the sustainable paving budget guide covers how to scope measurement costs within a capital improvement cycle.
What the evidence actually shows about paving project outcomes
The strongest empirical evidence for paving's community effects comes from a randomized controlled trial in Acayucan, Mexico, where street paving was assigned by lottery across neighborhoods. J-PAL's evaluation found that paved streets increased property values by appraisal estimates and led households to purchase more durable goods, including appliances and vehicles. A conservative benefit–cost analysis favored the investment. The randomized design rules out selection bias, making this one of the cleanest causal estimates available for street paving's economic effects. The mechanism is straightforward: better roads reduce vehicle wear, lower transportation costs, and signal neighborhood investment, all of which capitalize into property values.
On the equity side, the NSF-funded Massachusetts study quantified what planners often suspect but rarely measure: EJ communities face worse pavement conditions and bear a disproportionate share of the fuel and vehicle-wear costs that rough roads impose. That study's methodology, which links PCI scores to vehicle operating cost models, is directly replicable using HPMS data and EPA emissions factors.
FHWA's environmental guidebook compiles case examples from U.S. transportation projects that document social and environmental outcomes, including noise, air quality, community cohesion, and access effects. It is the most practical agency-level resource for planners who want precedent for their measurement approach.
Lessons from the evidence:
- Property value effects take 12–36 months to appear in assessor data. Do not conclude there is no economic impact at 6 months.
- Crash reductions are statistically noisy at the single-corridor level. Pool data across multiple project sites when possible, or use a 3-year post-construction window.
- Community perception improvements often appear faster than technical outcomes. Resident satisfaction surveys at 6 months frequently show significant gains even before crash trends shift.
- Null results on mobility time savings are common for resurfacing projects on low-volume local roads. Travel-time savings are more detectable on arterials with measurable congestion.
Tools and templates planners can actually use
Most municipal teams do not need to build measurement tools from scratch. The following resources cover the main collection and analysis tasks.
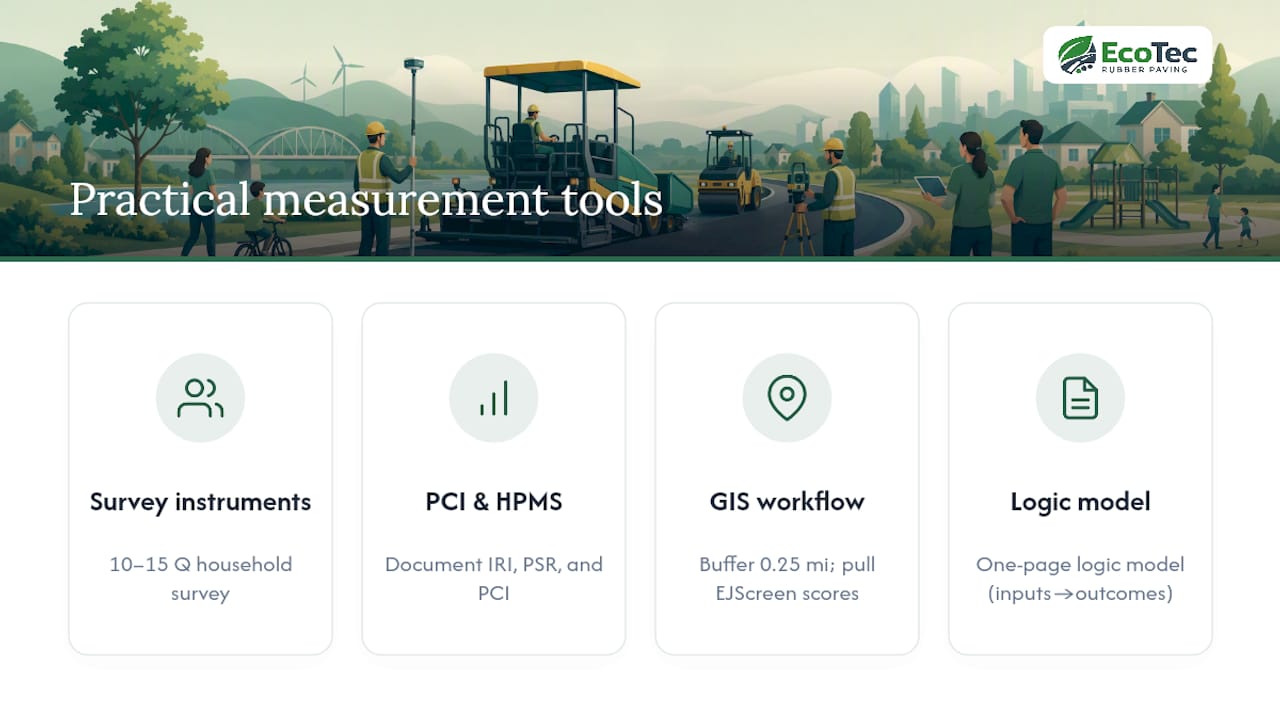
Survey instruments. A 10–15 question household survey covering perceived safety, road quality satisfaction, accessibility barriers, and standing-water complaints can be adapted from FHWA's community impact assessment guidance. Keep it to one page, offer it in Spanish and other locally spoken languages, and administer it both in-person and online to maximize response rates.
PCI and HPMS export checklists. FHWA's HPMS Field Manual specifies the data elements and coding conventions for pavement condition reporting. Before your project starts, extract the relevant HPMS segments for your corridor and document the current IRI (International Roughness Index) and PSR (Present Serviceability Rating) values alongside PCI. These three metrics together give you a richer baseline than PCI alone.
GIS EJ overlay workflow. Load your project corridor shapefile into EPA EJScreen or QGIS. For planners choosing between GIS platforms, a QGIS vs. ArcGIS comparison can help you select the right tool for your team's budget and technical capacity. Buffer the corridor by 0.25 miles, pull EJScreen percentile scores for the census block groups within the buffer, and document the scores in your assessment brief.
Logic model template. A one-page logic model with columns for inputs, activities, outputs, short-term outcomes, and long-term outcomes keeps your team aligned on what you are measuring and why. FHWA's environmental guidebook includes template formats that can be adapted for pavement projects.
S-LCA checklist. For projects where social sustainability documentation is required (federal grants, sustainability reporting), a simplified S-LCA checklist covers five categories: labor rights, health and safety, community access, cultural heritage, and governance. Map each category to at least one indicator from your indicator set.
Adapting for small towns. A rural county with limited staff can run a credible assessment with three data pulls: PCI scores from the state DOT, a 20-household survey, and crash data from the state crash database. That is a one-day data collection effort. The logic model and indicator documentation take another day. Imperfect measurement done consistently beats a comprehensive study done once and never repeated, a principle Bridgespan's research on community-driven change supports explicitly.
For large urban projects, the same framework scales up: add traffic count sensors, pedestrian counters, business intercept surveys, and a matched-control corridor. The indicator set stays the same; the data collection infrastructure grows.
Practical measurement tips from Ecotecrubber
Ecotecrubber's installation teams work directly with municipalities on rubber paving projects across Florida, and the measurement practices below come from that field experience.
- Set photo reference points before construction starts. Pick 5–10 fixed locations along the corridor (a fire hydrant, a utility box, a building corner) and photograph them from the same angle and distance. Post-construction photos from the same points give you visual before–after documentation that communicates to community audiences faster than any data table.
- Run a quick pedestrian accessibility audit. Walk the corridor with a checklist covering curb ramp condition, surface continuity, cross-slope, and detectable warning strips. A 30-minute walk-through before paving and another after gives you ADA compliance data that no remote dataset provides.
- Keep resident surveys short. Five to seven questions with a mix of Likert scales and one open-ended item take under three minutes to complete. Longer surveys drop response rates sharply. Offer a small incentive (a local business gift card works well) and administer in multiple languages.
- Track maintenance complaint volume. Ask your public works department to pull 311 or work-order data for the corridor going back two years before construction. Post-construction complaint volume is one of the cleanest, lowest-cost outcome indicators available. Ecotecrubber's rubber paving maintenance data shows that durable rubber surfaces reduce recurring complaint categories like cracking and standing water.
- Map drainage outcomes directly. For projects using porous paving systems, document standing-water complaint locations before installation and re-check after the first significant rain event. This is especially relevant for Florida municipalities where stormwater management is a primary community concern. Ecotecrubber's stormwater paving guidance details how drainage performance maps to measurable community outcomes.
- Document community-defined indicators formally. When residents name a priority (safer route to school, no more puddles at the bus stop), write it down as a formal indicator with a measurement method attached. That documentation is what lets you report back to the community in their own language and builds the trust that makes future measurement easier.
Key Takeaways
A credible community impact measurement combines technical KPIs from HPMS and state crash databases with community-defined indicators collected through participatory methods, evaluated against a pre-construction baseline using a before–after or quasi-experimental design.
| Point | Details |
|---|---|
| Start with a baseline | Pull PCI scores, crash data, and EJScreen values before construction; post-construction comparisons are meaningless without them. |
| Co-create indicators | Resident-defined priorities (safe school routes, reduced flooding) capture outcomes that HPMS and crash databases miss entirely. |
| Use quasi-experimental design when stakes are high | Matched comparison corridors strengthen causal claims and satisfy federal equity reporting requirements under Justice40. |
| Plan for a 1–3 year follow-up | Property value effects and crash trend shifts take at least 12 months to appear; a single 6-month data pull understates project benefits. |
| Ecotecrubber's Rubberway® system | Rubber paving installations generate measurable outcomes in drainage, ADA compliance, and maintenance reduction that map directly to community impact domains. |
Why the measurement conversation in paving is still missing the point
The standard critique of community impact measurement in paving is that it is too expensive, too slow, or too complicated for routine municipal projects. That critique is mostly wrong, and it tends to come from agencies that have never tried a lightweight version.
The real problem is not cost or complexity. It is that most pavement programs are still built around a single metric: PCI. PCI tells you the road is rough. It does not tell you that the rough road is in a neighborhood where 60% of residents commute by foot, or that the standing water at the low point of the block has been sending children to the emergency room with mosquito-borne illness for two summers running. Those facts exist. They are measurable. They just require asking the community.
The Bipartisan Infrastructure Law and Justice40 have created a policy window that did not exist five years ago. Agencies that build community impact measurement into their standard project workflow now will be better positioned for every competitive grant round that follows. The ones that wait for a perfect methodology will still be waiting when the next funding cycle closes.
Ecotecrubber's experience installing rubber paving surfaces in Florida municipalities reinforces this: the projects that generate the clearest community benefit data are the ones where the measurement plan was written before the first square foot of surface went down, not after.
Ecotecrubber supports measurement-aligned paving pilots for municipalities
Florida municipalities that want measurable community outcomes, not just a resurfaced road, have a direct path forward with Ecotecrubber's Rubberway® system. The difference from a standard paving contract is concrete: Rubberway® installations are designed to generate the drainage, ADA compliance, and surface durability outcomes that map directly to the impact domains this guide covers.
Ecotecrubber works with municipal clients to scope pilot installations that include pre- and post-installation monitoring checkpoints. Rubberway®'s porous design reduces standing-water complaints, a measurable community outcome that shows up in 311 data within the first rain season. The recycled tire material reduces landfill waste, which feeds directly into environmental impact reporting. ADA-compliant surfaces document accessibility improvements that satisfy federal reporting requirements. For municipalities navigating capital improvement cycles and grant applications, those documented outcomes are exactly what competitive funding reviewers want to see.
To discuss a pilot scope for your project, visit Ecotecrubber's municipal services page or review Rubberway® product specifications to see how the system's features align with your impact measurement goals. Reach out directly to get a project scope and timeline that fits your procurement process.
Useful sources for further reading
-
HERS Methodology (FHWA Appendix A) — Explains how the Highway Economic Requirements System uses HPMS inputs to rank pavement improvements by benefit–cost ratio, covering time savings, crash reductions, and vehicle operating costs. Essential for translating social-impact metrics into LCCA inputs.
-
NSF PAR: Social Sustainability of Pavement Deterioration — Quantitative methodology linking pavement condition to fuel consumption and equity burdens in EJ communities. The most rigorous U.S. study available on pavement's social sustainability dimensions.
-
J-PAL: Economic Returns to Street Paving in Mexico — Randomized evaluation showing property value and household welfare effects of street paving. The cleanest causal evidence available for paving's economic community impacts.
-
Bridgespan: How to Assess Community-Driven Change — Four guiding principles for co-created, learning-oriented community impact measurement. Directly applicable to participatory indicator development for paving projects.
-
Tufts FIC: Participatory Impact Assessment Framework — Practical tools (ranking, scoring, proportional piling) for community-defined indicators. Most useful when baseline data are weak or community priorities diverge from technical KPIs.
-
Urban Institute: Assessing Community-Level Initiatives — Literature review of quasi-experimental, synthetic control, and mixed-methods approaches for community-level impact evaluation. The go-to reference for evaluation design trade-offs.
-
EPA: Fast Facts on Transportation Greenhouse Gas Emissions — Standard emissions baseline data for estimating environmental co-benefits or disbenefits tied to pavement condition changes.